ProQuench v3.0
Advanced Quenchant Characterization Software with AI Insights
ProQuench v3.0 is a comprehensive desktop application for quenchant characterization, now featuring built-in AI Insights. Ask questions about your tests in plain language and get instant, data-driven analysis. Engineered to meet ASTM D6200-01 and ISO 9950:1995 standards. Available for Windows and macOS.
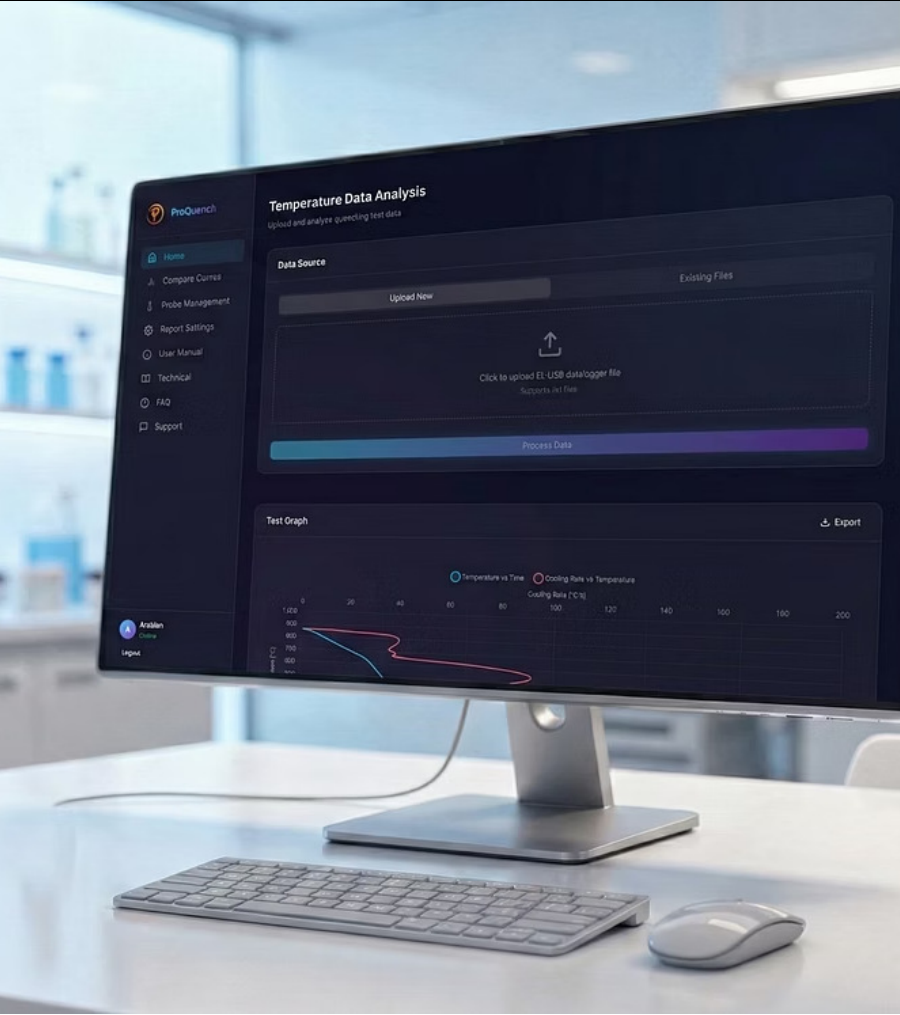
ProQuench v3.0 transforms the way you analyze quenching performance — now with built-in AI Insights so you can ask questions about any test in plain language and get instant data-driven answers. Engineered to meet ASTM D6200-01 and ISO 9950:1995 standards.
AI Insights
Ask questions about your tests in plain language. ProQuench V3's built-in AI assistant understands your cooling curve data and gives you instant, actionable answers — no data science expertise required.
Understand what a specific test result means — anomalies, phase transitions, and quality indicators explained simply.
AI cross-references your test against historical data to spot quenchant degradation early, before defects appear.
Ask the AI to compare any two tests or batches and get a concise performance summary with recommendations.
Instantly ask whether a test meets ASTM D6200 or CQI-9 specifications — AI gives a direct pass/fail with reasoning.
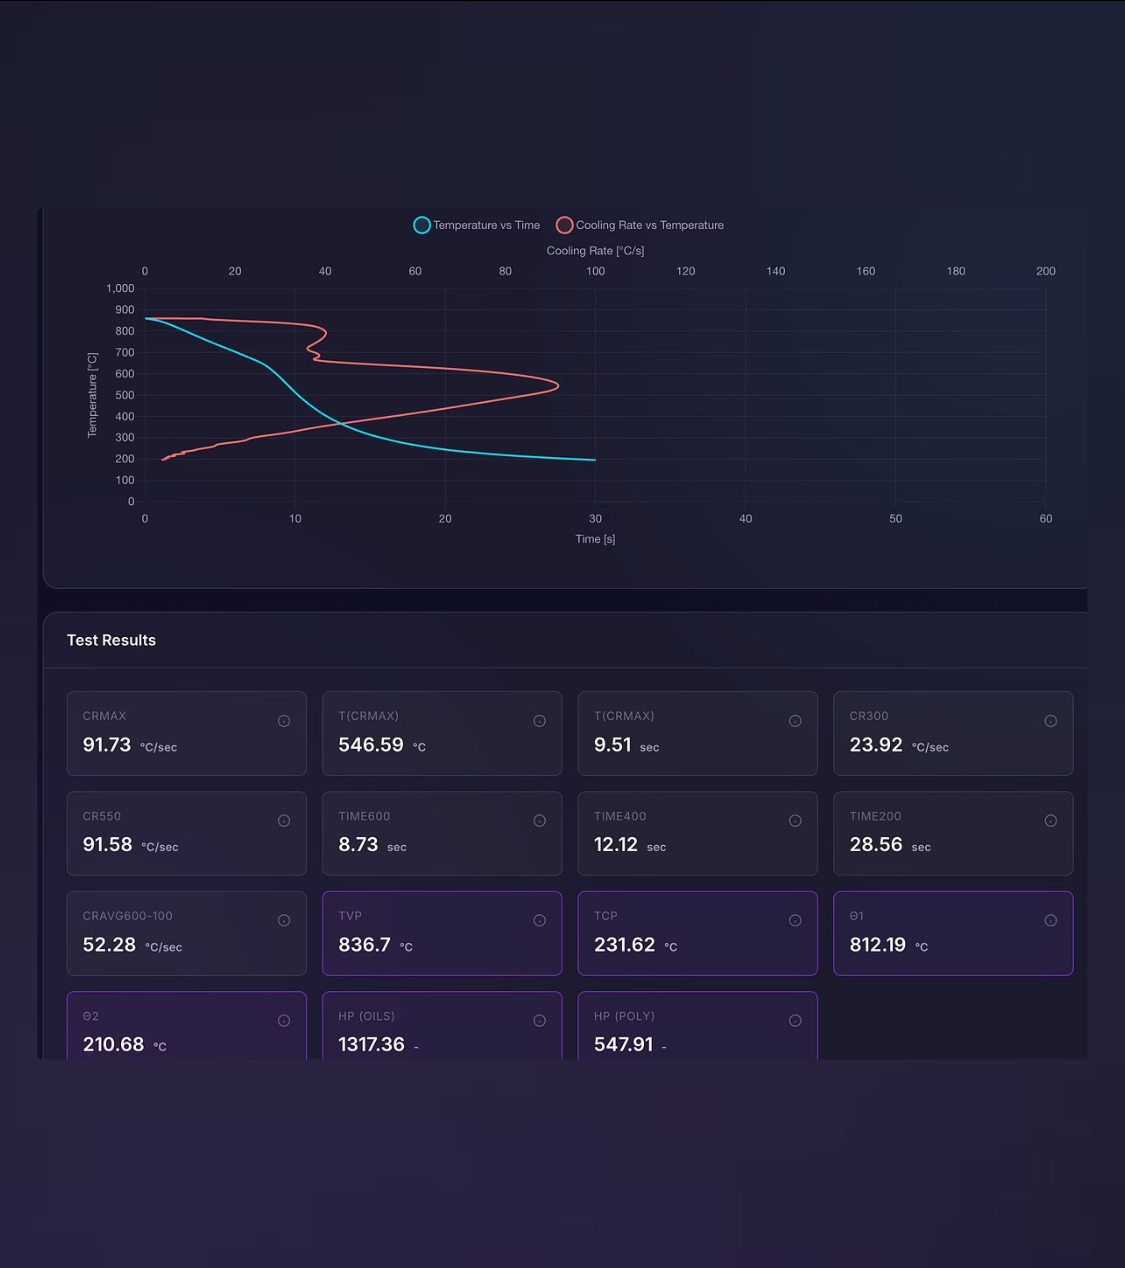
Advanced Cooling Curve Analysis
Upload your datalogger test files and instantly visualize temperature vs. time curves alongside cooling rate vs. temperature curves in interactive, high-resolution charts.
ProQuench's analysis engine calculates all critical quenching parameters automatically — eliminating manual calculation errors and saving valuable time.
Historical Cooling Rate Comparison
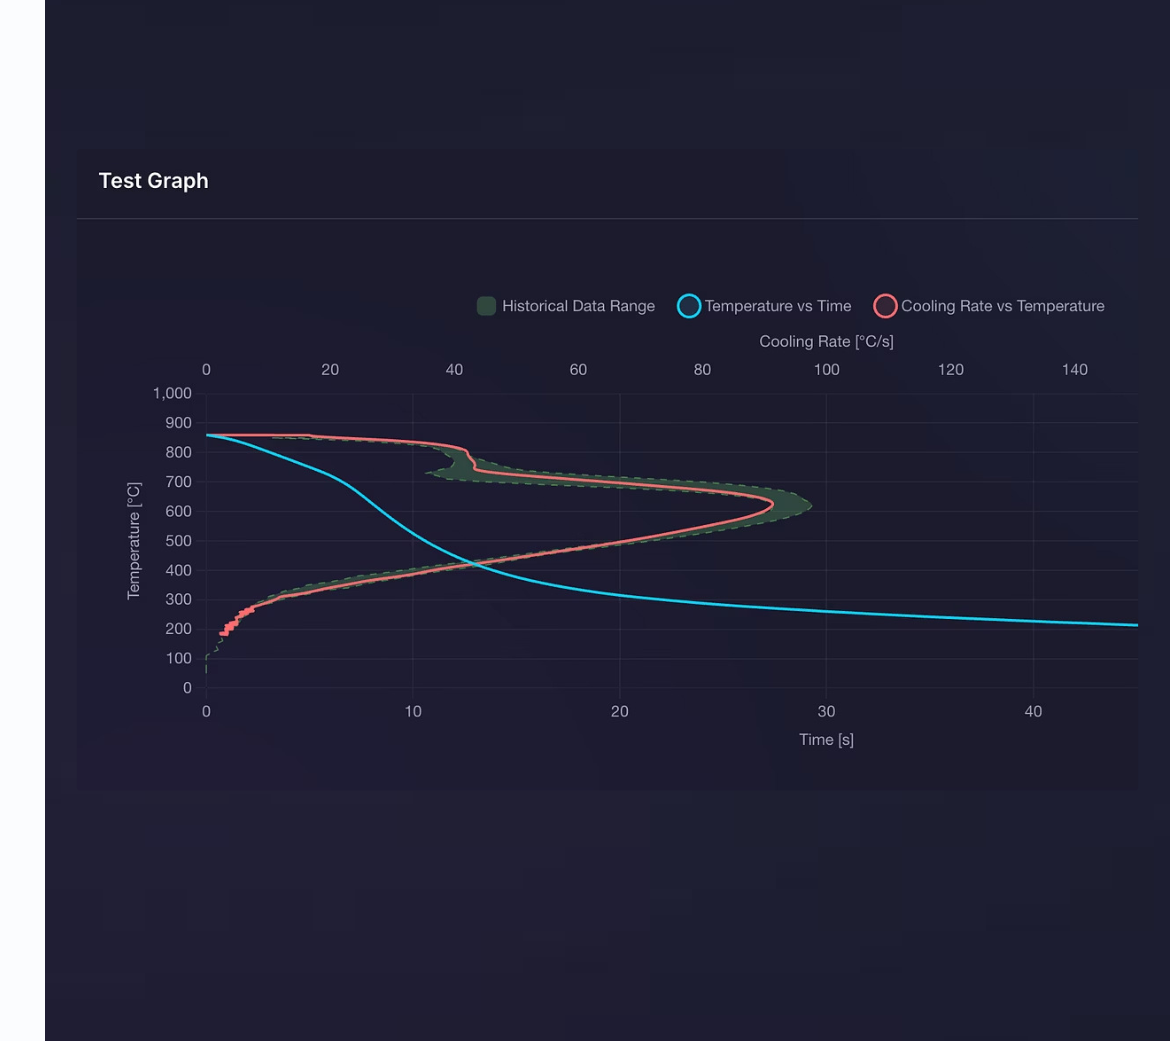
The cooling curve chart displays a historical cooling rate range as a shaded area graph behind your current test curve. This powerful feature shows the minimum–maximum range from all previous tests using the same quenchant, providing critical context for every analysis.
Instantly identify if your test falls within expected parameters based on historical data.
Detect quenchant degradation or batch inconsistencies before they impact product quality.
Make confident decisions with comprehensive historical context and trend analysis.
Multi-Curve Comparison Capabilities
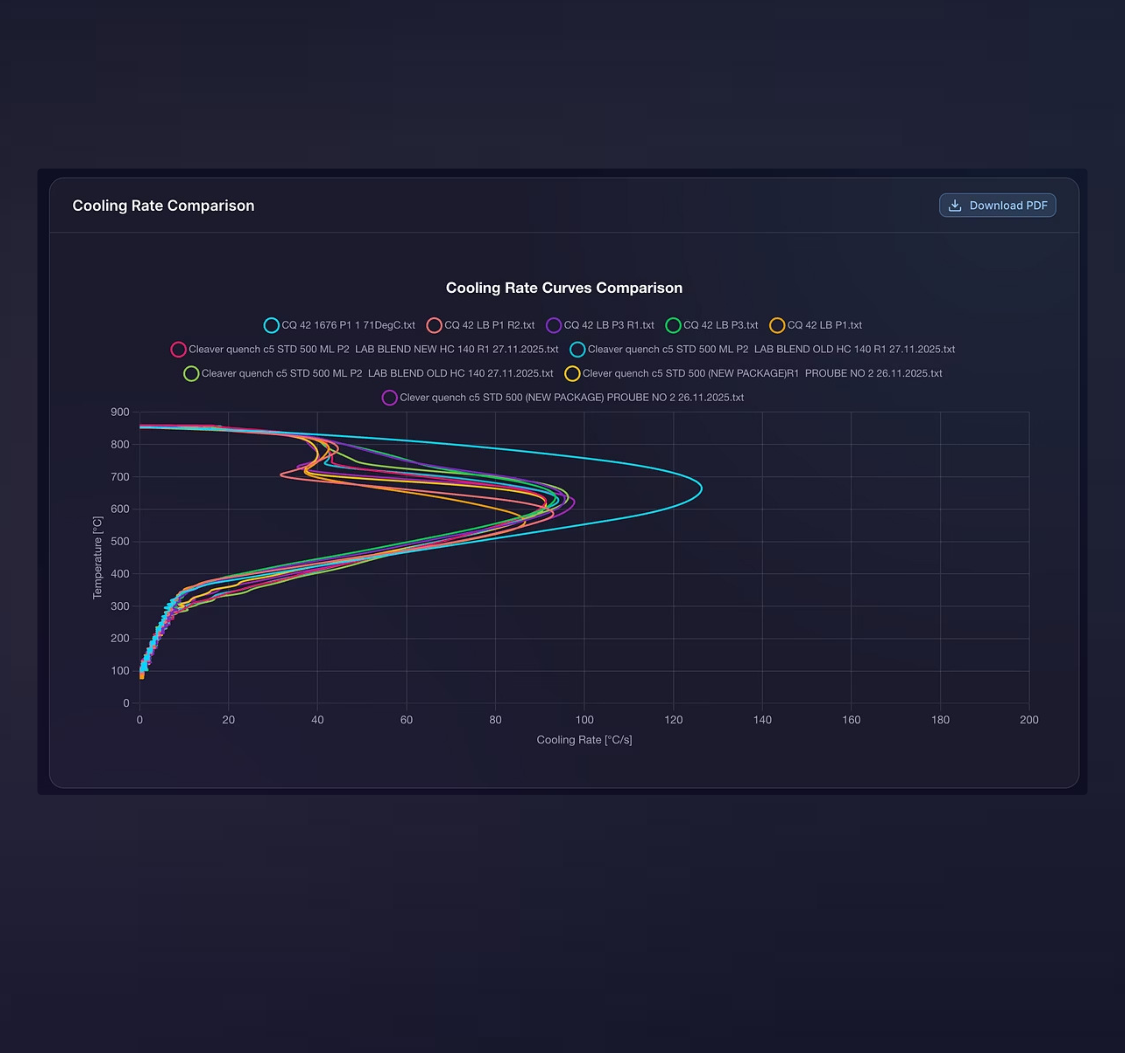
Compare up to 10 cooling curves side-by-side to identify performance variations across batches, quenchants, or testing conditions. Sophisticated overlay visualization makes trend analysis effortless — spot subtle differences that could indicate process variations or quality concerns.
- Batch-to-batch consistency verification
- New quenchant evaluation against established baselines
- Long-term performance monitoring of heat treatment media
- One-click PDF export of comparison charts
Comprehensive Probe Management
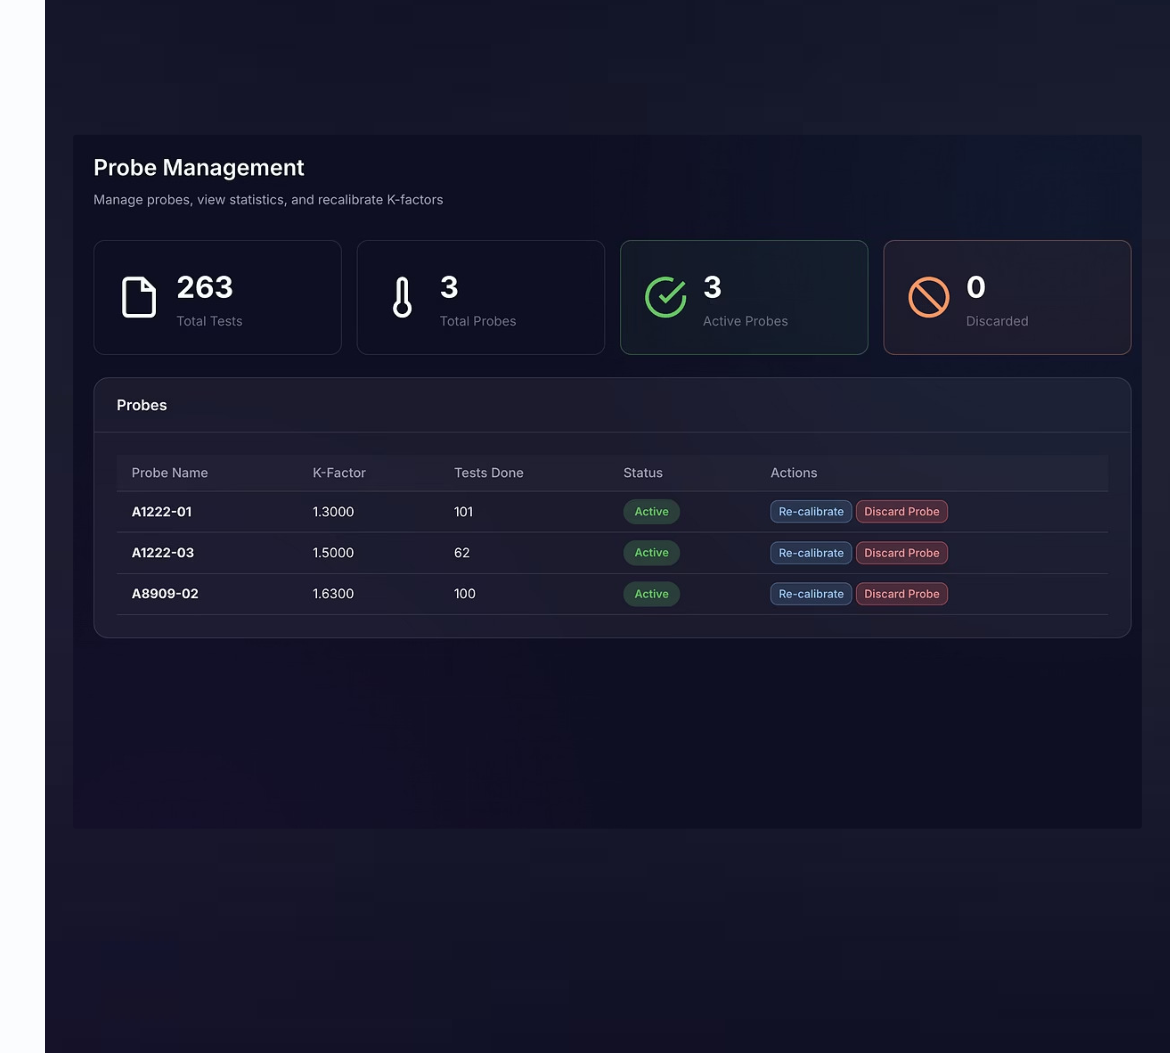
Track your measurement probes with complete visibility and control. ProQuench's probe management system ensures your testing equipment maintains calibration integrity and provides full audit trails for quality assurance compliance.
View detailed probe usage history and test counts for maintenance scheduling.
Monitor and recalibrate K-factors with real-time calibration status indicators.
Maintain complete records when discarding worn probes for compliance documentation.
Professional PDF Reporting
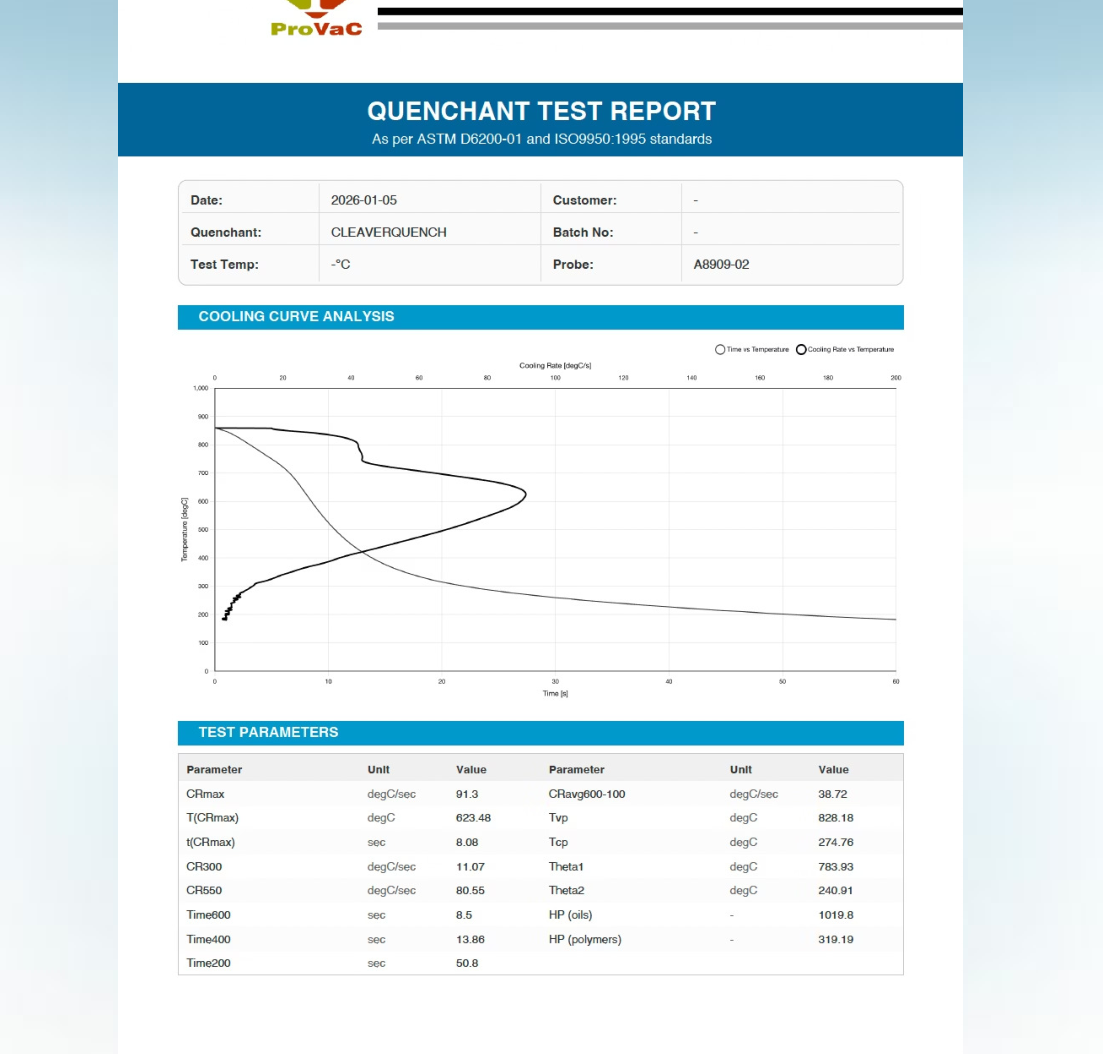
Generate publication-ready reports with a single click — perfect for customer deliverables, internal documentation, and regulatory compliance submissions.
- Custom header & footer branding with your company logo
- Complete test parameters and cooling curve graphics
- Customer name, batch number, and quenchant details
- ASTM D6200-01 & ISO 9950:1995 formatted layout
- Easy export for long-term compliance archives
Built-in Technical Resources
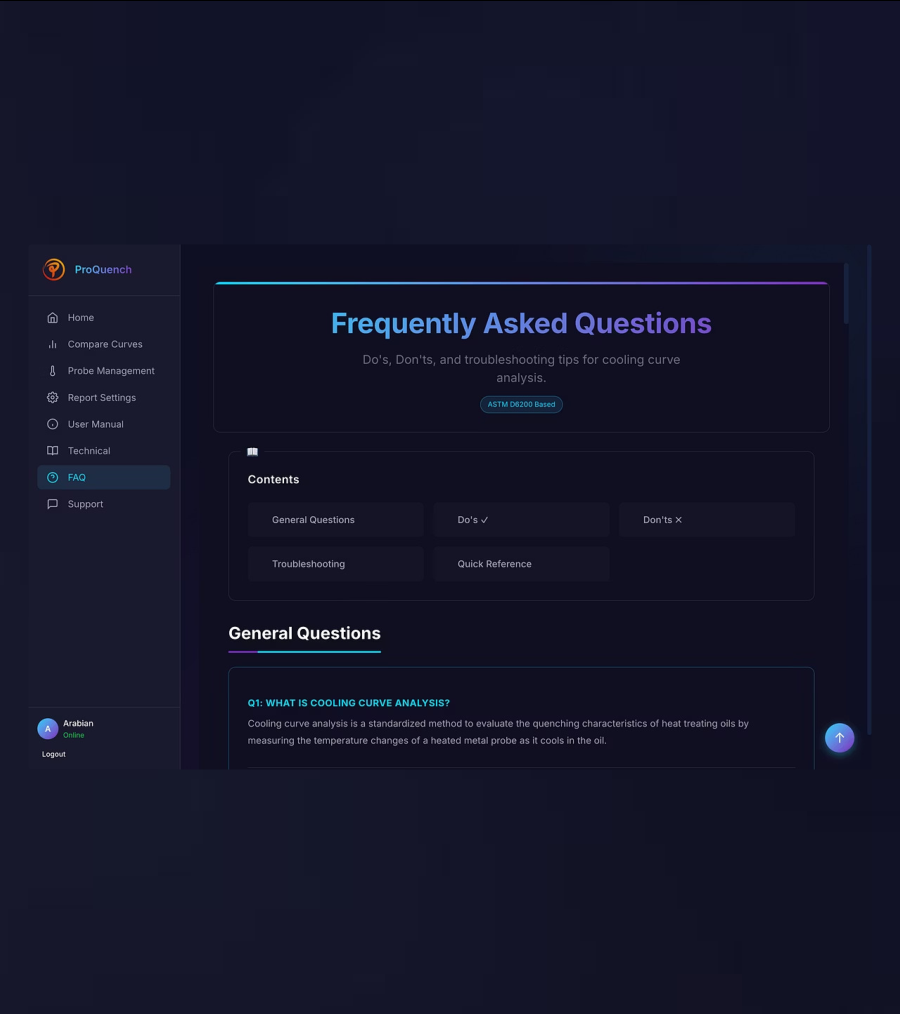
Access comprehensive documentation directly within the application — no external manuals needed. Every aspect of ProQuench is documented in plain language, right where you need it.
- User Manual — Step-by-step guidance for all features
- Technical Docs — Calculation methodology per ASTM D6200
- FAQ Section — Do's, don'ts, and troubleshooting tips
Secure, Cross-Platform Access
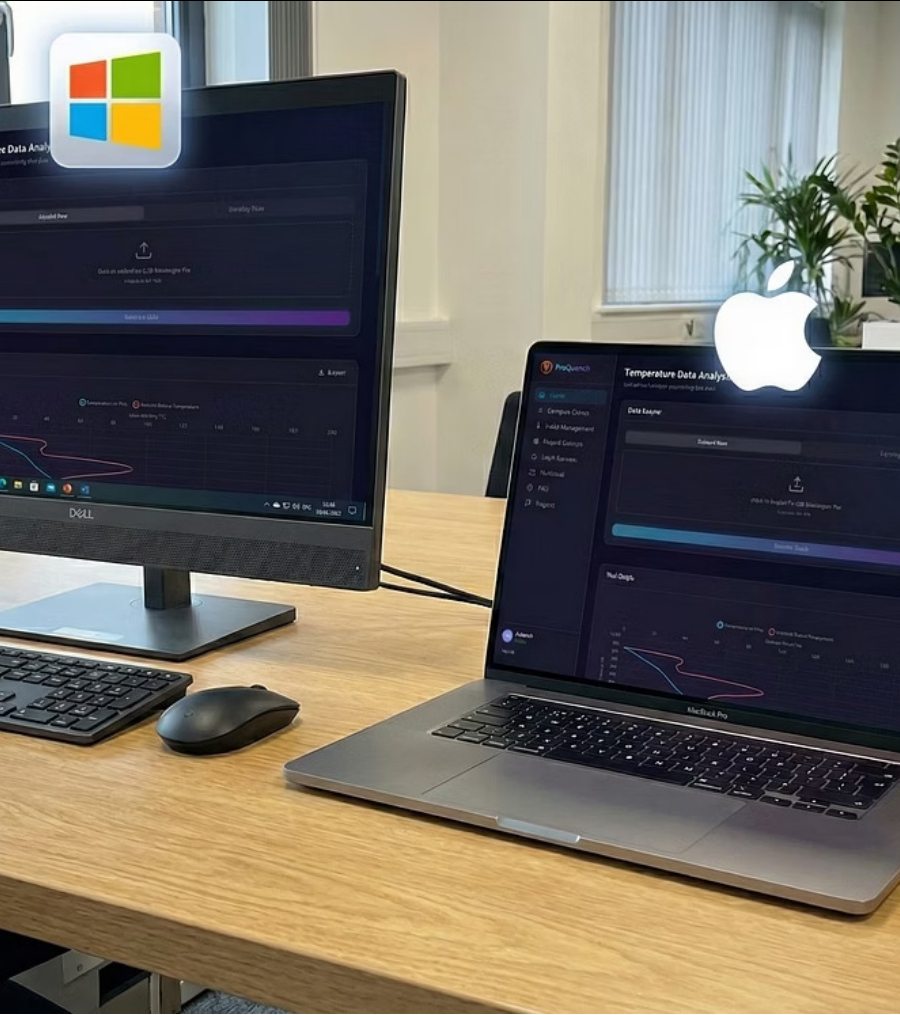
MAC address-based licensing ensures secure, authorized access with no subscription fees or cloud dependency. Authentication happens automatically in the background — just install and run.
- Windows — Installer for x64 & ARM64
- macOS — DMG optimized for Apple Silicon
- License — Per-device MAC address binding
Specifications
Up and Running in 3 Steps
Download the Installer
Access the installer for your platform — Windows (.exe) or macOS (.dmg) — from the secure download portal.
Run the Application
Launch ProQuench. License verification happens automatically in the background via MAC address.
Upload & Analyze
Upload your first datalogger file and start analyzing quenchant performance with confidence.
Ready to Transform Your Quenchant Testing?
Download ProQuench v2.0 or contact us for licensing and support.